2023 NFL Draft Class Analysis - RB
- Jonah Lubin

- Sep 14, 2023
- 3 min read
Updated: Oct 5, 2023
Before the 2023 NFL Draft, I decided to make metrics for several positions in order to determine the value of each prospect. Specifically with RB, there are ongoing discussions about how much value a team should put in running backs. This value can be viewed either monetarily or by draft pick position. This past draft, the Lions and Falcons both selected running backs in the top 12 picks of the draft, clearly showing they value running backs a great amount. I wanted to find an objective way of finding the value of each RB prospect, so I created a metric to do just that.
*As a quick disclaimer before I reveal the rankings that my metric decided, I want to say that the data I have/had access to is not nearly encompassing of all important data, so the metric I created was limited in its capabilities.*
Now I will move on to how I determined how to create the RB metric. The basic method I used was to identify the certain statistics that correlated to success in the NFL. I did this by looking at RBs drafted since 2014 and came up with a NFL Success Metric that gives them a value for how productive they had been in the NFL and did correlation work on each of their statistics.
I also looked at RBs that were busts or just noticeably unproductive in the NFL and see which statistics they did poorly/well in to see the correlation with NFL success there.
After weighting all of these statistics based off of their exact correlation to NFL success, I came up with the RB Predictive Success metric. Here is a graph that shows the correlation between the two metrics:

There is a clear strong positive correlation with these two metrics, but there are obviously many players that graded high in the RB Predictive Success Metric and graded low with the NFL Productivity Metric, and vice versa. This was practically a given before doing this work, as a perfect model would be basically impossible to create with limited data; however, this is a decently strong correlation.
After determining the correlation for this metric, I decided to run the model on each of the RB prospects. Using this model, I calculated their RB Predictive Success Metric, their predicted NFL Productivity metric value, and the upper and lower confidence intervals for those predicted NFL Productivity metric value. This was all done using linear regression based off the correlation above. Here are the results:
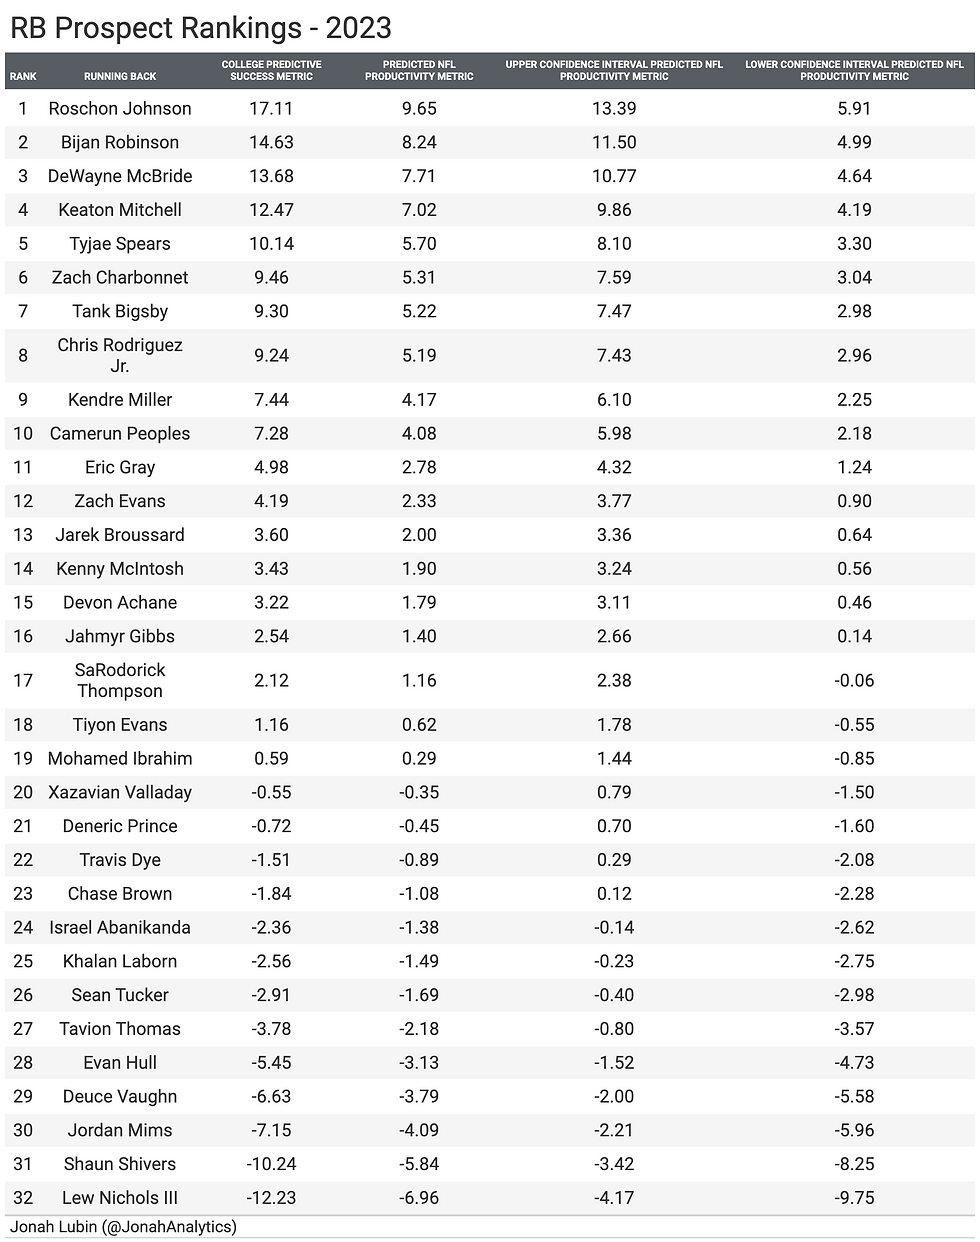
These values might not mean much with no context, but the ranking is definitely noteworthy. Roschon Johnson, 4th Round Pick out of the University of Texas, is ahead of the rest of the RB prospects from this recent draft. He is ironically one spot ahead of the player who started before him at the University of Texas, Bijan Robinson. Johnson has already played one game with the Chicago Bears and was able to showcase his talent right away, and I expect the Bears to become well aware of what he can bring to that backfield very soon.
Jahmyr Gibbs was the 12th overall pick in the NFL Draft, but ranked as the 16th best RB prospect of the draft class. Gibbs being drafted that high in the draft was controversial due to him being a position of lower value than others, but if he is also not an elite running back relative to the rest of the class, the pick makes even less sense. Keep in mind that this is a model and not 100% accurate, so Gibbs could prove these rankings wrong. It is just more likely that he does not compared to other running backs.
In order to provide some context for the metrics above, here are some of the current RB's NFL Productivity metrics:

Now that you have context, you can compare certain prospect's predicted NFL Productivity Success Metric and the current NFL RB's metrics.
Bijan Robinson, for example, has a predicted NFL Productivity Metric of 8.24, which puts him at the same exact value as Tyler Allgeier, which is obviously very ironic as they share a backfield. I also provided the upper and lower confidence intervals to get a sense of floor and ceiling for each player. Roschon Johnson's ceiling is above the productivity of Ezekiel Elliott and Josh Jacobs, but below that of Dalvin Cook and Derrick Henry. Johnson's floor would be around Alvin Kamara and Leonard Fournette, who have had good careers, but not as great as we would have initially wanted from them.
Jahmyr Gibbs's ceiling is around the same as the career production of Phillip Lindsay, Rashaad Penny, and Gus Edwards. This is not a player comparison, as he has a clearly very different play style than these three, but it is a productivity comparison, which is not very encouraging for Gibbs.


Comments